West Side Avenue crashes in Jersey City
West Side Avenue had 15 crashes that killed or seriously hurt someone from January 1, 2019 to September 30, 2026, tied for ninth among Jersey City roads, NJDOT's public records show as of October 7, 2026. 1 of them killed someone. 6 involved someone on foot.
- 1
- killed someone
- 14
- seriously hurt someone
- 607
- crashes of every kind
40% involved someone on a bike (6 of 15). Citywide, it was 15%.
See it on the full map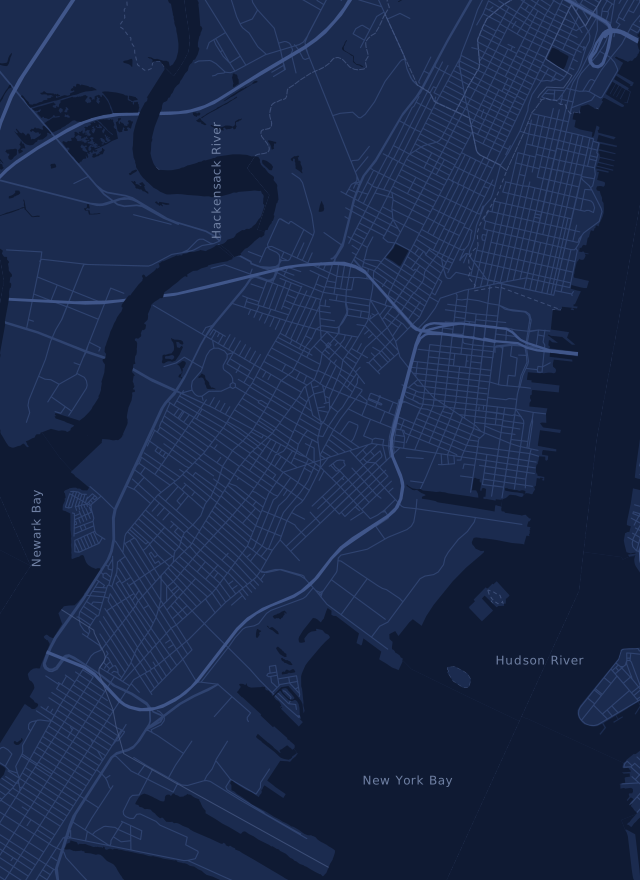
Point at a cross street or a dot on the chart below to find it on the map.
Where on West Side Avenue
The most crashes of every kind were where it meets Sip Avenue, Duncan Avenue and Communipaw Avenue. Crashes that killed or seriously hurt someone were most often where it meets Boyd Avenue: 2.
Swipe the chart sideways to follow the road.
Gray bars count every crash on West Side Avenue with a map location, from its south end to its north end. Dots are the 14 that killed or seriously hurt someone. Bigger dots killed someone. Cross streets are the ones police wrote most often, placed at the middle of their crashes.
Cross streets with the most crashes that killed or seriously hurt someone
- West Side Avenue at Boyd Avenue2
- West Side Avenue at Duncan Avenue2
- West Side Avenue at Spring Street2
- West Side Avenue at Stegman Parkway2
- West Side Avenue at Communipaw Avenue1
People on bikes are hurt more often on West Side Avenue
6 of the 15 crashes involved someone on a bike. That is 40%, against 15% for the whole city.
Crashes that killed or seriously hurt someone, January 2019 to September 2026. Each crash counts once: someone on foot, then on a bike, then a motorcycle.
West Side Avenue, year by year
The worst year was 2025, with 8. Counts jump around from year to year, so read single years with care.
* 2026 runs through September 2026. NJDOT calls these records preliminary.
Other dangerous roads in Jersey City
Ranked by crashes that killed or seriously hurt someone, January 2019 to September 2026.
All Jersey City crash data- Kennedy Boulevard, rank 1, 9 killed someone65
- Route 440, rank 2, 7 killed someone36
- Truck Routes 1 and 9, rank 3, 6 killed someone24
- Interstate 78, tied for rank 4, 2 killed someone23
- Ocean Avenue, tied for rank 4, 2 killed someone23
- Communipaw Avenue, rank 6, 3 killed someone22
- Grand Street, rank 7, none killed anyone17
- Martin Luther King Jr. Drive, rank 8, none killed anyone16
- Tonnelle Avenue, tied for rank 9, 2 killed someone15
Hurt in a crash on West Side Avenue?
General information, not legal advice. If you want a lawyer, compare the car accident firms we ranked in Jersey City before you call.
How we counted
- Every crash NJDOT's public crash dashboard lists for Jersey City from January 1, 2019 to September 30, 2026, saved October 7, 2026. NJDOT calls these records preliminary. New crashes can take weeks to appear, and older ones can change.
- Killed or seriously hurt means the worst injury in the crash was a death or a suspected serious injury, the top two of the five levels police use. We count crashes, not people.
- A crash counts toward West Side Avenue when the police report puts it there. Spellings of one road count as one, and the far side of a divided road counts as the same road.
- Cross streets are the ones police wrote on the reports. Places on the chart and the map are where NJDOT put each crash. 1 of the 15 crashes have no usable location; they still count in every total.
- The chart runs along the line that best fits the crash points, from the south end to the north end. On a road that bends, places along it are close, not exact.
- Counts are not adjusted for traffic or road length. A long, busy road will have more crashes.
- Crash numbers never change a law firm's score.
Use this data
Free to reuse with credit to Counselworthy and a link to this page. The crash file lists NJDOT's crash ID on every row, so anyone can check one.