Compare(0) firms picked

Jersey City crash map

NJDOT's public records list 48,959 crashes in Jersey City from January 1, 2019 to September 30, 2026, and 571 killed or seriously hurt someone. Type your street to see every crash on it. Filter by injury, road, year and who was involved, then replay them month by month. Records saved October 7, 2026.

571 crashes match · 561 on the map · Jan 2019 to Sep 2026

Filters2 on
Worst injury in the crash
Who was involved
Years
None picked shows every year. 2026 runs through September 2026.
Most dangerous roads
The 25 roads with the most crashes that killed or seriously hurt someone. The number is those crashes.
Show on the map

Your filters and street stay in the link, so you can share this exact view.

The HeightsJournal SquareDowntownBergen-LafayetteWest SideGreenville
Killed someoneSeriously hurt
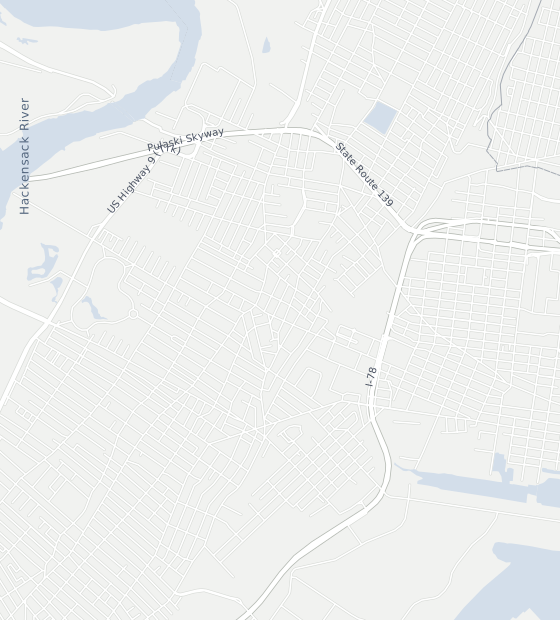
This picture shows the 561 crashes that killed or seriously hurt someone. The full map, with its filters, needs JavaScript; every crash is also in the crash file.Each dot sits where NJDOT placed the crash. Tap one for its record. Map: OpenFreeMap, data © OpenStreetMap contributors. City outline and High Injury Network: City of Jersey City, last edited 2022. Crashes: NJDOT public crash dashboard, saved October 7, 2026. Preliminary records.
Jan 2019 to Sep 2026571 crashes

Back to the Jersey City crash data: the most dangerous roads and intersections, who gets hurt, and how we counted.