Hoboken's most dangerous roads
From January 1, 2019 to September 30, 2026, 761 crashes in Hoboken hurt someone, NJDOT's public records show as of October 12, 2026. Washington Street had the most, 94. People on foot were in 28% of them. NJDOT has only part of the city's crashes from February 2023 on.
crashes in Hoboken hurt someone.
719 have a usable location, and 1 of those is just past the edge of this map. 42 had no usable location and still count in every total.
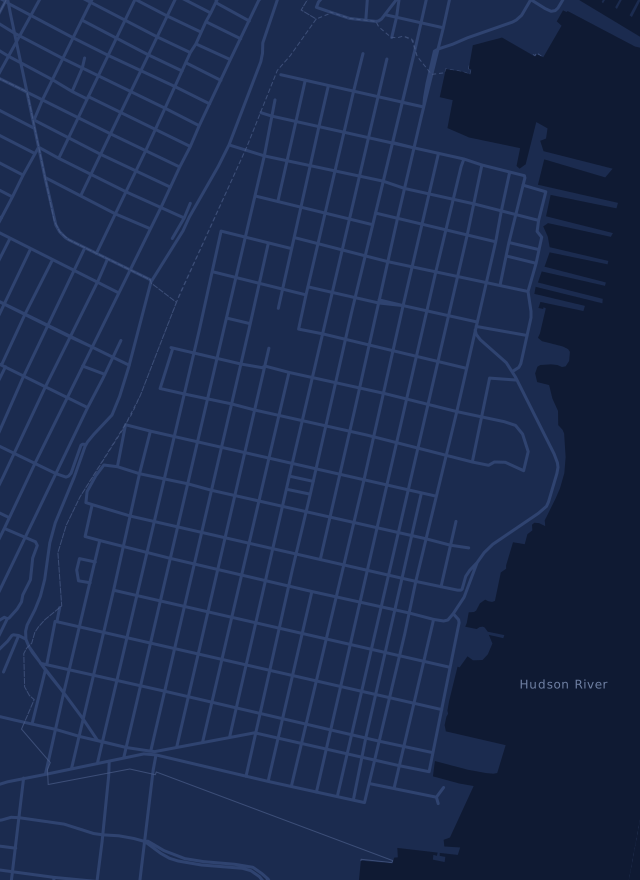
The most dangerous roads and corners in Hoboken
Washington Street had 94 crashes that hurt someone. Willow Avenue is next, with 84.
Whole roads
Whole roads count every crash the police report puts on that road, including crashes with no usable map location. Counts are not adjusted for traffic or road length.
Each road has its own page, with where along it crashes happen: Washington Street, Willow Avenue, Park Avenue, Observer Highway, 14th Street, Newark Street, 1st Street, Bloomfield Street, Garden Street and Monroe Street.
500 m squares
Squares are 500 by 500 meters, named for the road with the most of these crashes inside. They catch corners and short stretches that a whole-road count spreads out.
Intersections, 2019 to 2026
Every year from 2019 to 2026, since one year has too few crashes at any one corner to rank. People hurt counts everyone injured or killed, from a possible injury to a death. A crash counts at an intersection when the report names both streets. Source: NJDOT public crash dashboard, 2019 to 2026.
6 seriously hurt someone. 27 involved someone on foot. 459 crashes of every kind.
Everything on Washington StreetPeople on foot are in 3 in 10 crashes that hurt someone
Crashes involving someone on foot are 6% of all crashes in Hoboken. They are 28% of the crashes that hurt someone.
Each crash counts once, in the first group that fits: someone on foot, then someone on a bike, then a motorcycle. Percents are of each row. January 2019 to September 2026. Source: NJDOT public crash dashboard.
Ranked on public records: car accident firms in Hoboken.
1 in 6 car or minivan crashes hurt someone
Cars are still in the most of these crashes, 544, because they are in most crashes of every kind. Pick a vehicle to compare.
A crash with a car and a motorcycle counts for both, so rows overlap. The worst injury in the crash decides it, not who caused it or who was in which vehicle. Every group here had at least 100 crashes. Left out with fewer: Motorcycle, Moped or bicycle and Other or unknown. Vehicle types from NJDOT, saved October 12, 2026.
crashes involving a car or minivan hurt someone: 544 of 3,227.
Cars and minivans are in the most of these crashes, 544, because they are in most crashes of every kind.
Fall is the worst season
In the 4 full years from 2019 to 2022, Hoboken averaged 12.9 crashes that hurt someone every 30 days in fall. Winter had the fewest: 9.0. October was the worst month.
Fall: 157 crashes over 364 days, or 12.9 every 30 days. Crashes are divided by the days in each month, then multiplied by 30, so short months don't look safer. 518 crashes from the 4 full years. 2023, 2024 and 2025 are left out because NJDOT's records for them are incomplete. 2026 is left out because it isn't over. This shows a pattern, not a cause.
Evenings are the most dangerous hours
Nearly half of these crashes, 337 of 761, happened between 4 pm and midnight. The worst 4-hour slot was Thursday from 4 to 8 pm, with 35.
| 12 to 4 am | 4 to 8 am | 8 am to noon | Noon to 4 pm | 4 to 8 pm | 8 pm to midnight | |
|---|---|---|---|---|---|---|
| Mon | 12 | 5 | 19 | 32 | 23 | 13 |
| Tue | 0 | 7 | 19 | 25 | 32 | 21 |
| Wed | 6 | 8 | 24 | 33 | 25 | 24 |
| Thu | 1 | 10 | 29 | 26 | 35 | 24 |
| Fri | 6 | 3 | 17 | 32 | 27 | 17 |
| Sat | 12 | 3 | 16 | 26 | 24 | 22 |
| Sun | 18 | 1 | 17 | 17 | 29 | 21 |
| All | 55 | 37 | 141 | 191 | 195 | 142 |
Darker squares had more crashes. January 2019 to September 2026, by the time police wrote on the report. Not adjusted for how much traffic is out at each hour.
Month by month since January 2019
The worst month was September 2021, with 21 crashes that hurt someone. None happened in 2 of the 93 months. Press play to watch them build up on the map.
None killed anyone. 21 on the map.
The drop from February 2023 is NJDOT missing records, not fewer crashes. Yearly totals swing a lot, from 79 in 2020 to 168 in 2022, the full years before February 2023. NJDOT calls these records preliminary, and how police code injuries can change, so we don't call one year a trend. 2026 runs through September 30, 2026.
See the crashes on your street
All 4,389 crashes since January 2019, from fender benders to deaths, on one map. Type your street to see every crash on it. Filter by year, injury and who was involved, replay them month by month, and tap a crash for NJDOT's record.
Find your streetHurt in a crash here?
General information, not legal advice. If you want a lawyer, compare the car accident firms we ranked in Hoboken before you call.
How we counted
- Every crash NJDOT's public crash dashboard lists for Hoboken from January 1, 2019 to September 30, 2026: 4,389 crashes, saved October 12, 2026. NJDOT calls these records preliminary. New crashes can take weeks to appear, and older ones can change.
- Hurt someone means the report lists an injury: a death, or a suspected serious, minor or possible injury, the top four of the five levels police use. We count crashes, not people. 35 crashes here killed or seriously hurt someone, too few to rank roads on, so this page counts every crash that hurt someone.
- NJDOT also lists 1 death in 1 crash it rates below fatal. We count each crash by its rating. The crash file shows both, so anyone can check.
- A crash counts toward a road when the police report puts it there. Spellings of one road count as one: "HUDSON COUNTY 675" and "WILLOW AVENUE (HUDSON COUNTY 675)" are both Willow Avenue, by the city's own street map. Where one county route number covers two roads, the crash's location or cross street decides which.
- NJDOT's dashboard lists far fewer Hoboken crashes from February 2023 on: about 30 a month, against about 63 before. The city counted 1,399 crashes reported to police in 2023, and NJDOT lists 334. We keep every record NJDOT has, and leave the years since out of the season averages.
- Dots sit where NJDOT placed each crash. Where NJDOT's records give no point, mostly before 2023, the dot sits where the two streets on the police report meet, on the city's own street map. We checked that on 1,102 crashes that have both: half land within 14 meters of the report's point, and 9 in 10 within 48. 719 of the 761 crashes have a location. We don't guess the other 42, and they still count in every total.
- Counts are not adjusted for traffic or road length. A long, busy road like Washington Street will have more crashes.
- Vehicle shares use every crash involving that kind of vehicle. A crash with a car and a motorcycle counts for both.
- Seasons use the 4 full years, 2019 to 2022, and divide by the days in each month.
- These are police reports. A crash nobody reported isn't here. If you need the report for your own crash, ask the police department that took it.
- Crash numbers never change a law firm's score.
Use this data
Free to reuse with credit to Counselworthy and a link to this page. The crash file lists NJDOT's crash ID on every row, so anyone can check one.
Counselworthy, "Hoboken's most dangerous roads," from NJDOT public crash records, January 2019 to September 2026, saved October 12, 2026. counselworthy.com/nj/hoboken/crash-data/